-
Power BI – A Visualization Tool which is easy to understand and develop
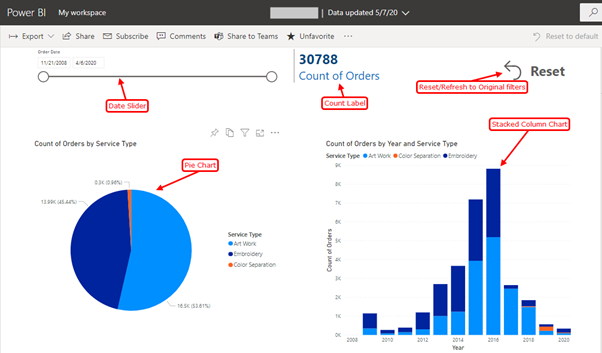
DATE:Power BI is a tool used for generating business intelligence reports, charts and graphs, that incorporate easy to understand visuals. […]
Tags
- .Net
- .Net Application Development
- .Net Core
- .Net web applications
- .NetCore
- A/B Testing
- Agile development
- Agile methodology
- Agile Testing
- AI
- AI for enterprises
- AI software development
- ANTS
- APACHE
- API
- APM
- app integration
- app integration development
- App Monitoring
- Application Integration Development Company
- Application Performance Monitoring
- ASP Dot Net developer
- ASP web application
- ASP.NET
- ASP.Net core
- ASP.Net developers
- ASP.Net Development Company in India
- ASP.NET Framework
- ASP.NETCore
- Authentication
- Automation Testing
- Autonomous Testing
- Azure AI services
- Azure Application
- Azure application development services
- Azure certified experts
- Azure certified professionals
- Azure cloud
- Azure Development Company
- Azure Development Services
- Azure Outsourcing Company
- Azure Software Development
- Azure Storage
- Barcode
- Barcode scanning
- BDD
- Bespoke software
- bespoke software development
- bespoke software development company
- Best Learning App for Kids
- BIG DATA
- BLE
- BlueTooth
- Bootstrap
- Bootstrap 4
- Built with SASS
- business app development
- business growth with AI
- Cake PHP
- Cake PHP web development
- Chatgpt
- Children Learning App
- Claris
- Claris Filemaker
- Claris International
- Claris Partners Filemaker
- Claris Partners Outsorucing company
- Claris Partners Outsourcing Company in India
- Client-side Framework
- Cloud computing experts
- Cloud computing professionals
- cloud computing strategy
- cloud migration services
- Configuring Mapbox
- contact our web development experts.
- Content management system
- CRM
- CSS Framework
- custom AI solutions
- custom app
- custom app services india
- custom application development
- custom application development services
- Custom apps
- Custom FileMaker development
- custom filemaker development india
- Custom map
- custom software company
- Custom software development
- custom software development company
- custom software development outsourcing company
- custom software development outsourcing partner
- custom software development services
- Custom Software solutions
- custom web app
- custom web application development
- custom web application development company
- Customizing Mapbox
- CWP
- Dashbaord
- data partioning
- Database applications
- Database Consultants
- developer
- DevOps
- dot net
- Dot Net application
- Dot Net application developers
- Dot Net application development
- Dot Net application development company
- Dot Net application development DotNet Core 3.0
- Dot Net Core
- dot net developer
- Dot Net developers
- Dot Net Development
- dot net development company
- Dot Net Development Company in India
- dot net development services
- Dot Net Framework
- dot net programmer
- dot net services in india
- Dot NET Software Services India
- Dot Net Software Solutions
- Dot Net Solutions Outsourcing Company
- DotNet
- DotNet application development
- DotNet Core 3.0
- DotNet Development Company
- DotNet framework
- DotNet programmer
- DotNet run
- dotnet software services india
- DotNetCore 3.0 developers
- dotnetcore application development services
- Drop down list
- Enterprise app development
- Enterprise Application Integration Services
- Enterprise mobile app development
- Enterprise Mobile Application Development
- EWS
- FBA
- FileMaker
- filemaker 12 india
- filemaker 13 india
- FileMaker 16
- FileMaker 19
- FileMaker benefits
- FileMaker certified developers
- FileMaker Cloud
- FileMaker consultant
- FileMaker consultants
- FileMaker CRM Software Outlook Integration
- FileMaker custom app
- FileMaker developer
- FileMaker developers
- FileMaker developers in India
- FileMaker development
- FileMaker development company
- filemaker development in india
- filemaker development india
- filemaker development services
- filemaker expert
- FileMaker Go development
- FileMaker integration
- FileMaker Licensing
- FileMaker low code
- FileMaker PHP API
- FileMaker Plug-Ins
- FileMaker Plug-Ins Dacons
- FileMaker Pro
- filemaker pro 12 india
- FileMaker Pro Addvanced
- FileMaker Pro Advanced
- FileMaker Pro Certified Developers.
- Filemaker Pro Developers & Consultants India
- filemaker pro programmers india
- filemaker prodatabase india
- FileMaker Programmers
- filemaker programmers india
- FileMaker Server
- FileMaker services
- filemaker services in india
- FileMaker solution
- filemaker specialists
- FileMaker web applications
- filemaker web solutions india
- FileMaker/PHP/MySQL
- FileMaker19
- Genavix
- Google charts
- HADOOP
- Health tracking app
- Health tracking software
- Hire FileMaker developers
- Hiring React development company
- Inbody integration
- Java
- jQuery
- JSON
- LAMP
- Legacy app migration
- LINUX
- Load Testing
- low-code comparison
- low-code development tools
- low-code platform
- machine Learning
- MailKit
- mapbox
- Mapbox studio
- MCSA exam
- MetaBiz
- MetaKidzo
- Microservices. ASP.Net
- Microsoft Azure
- Microsoft Azure AI
- Microsoft Azure consulting
- Microsoft technologies
- Mobile app development
- Mobile Apps
- MySQL
- MyZone
- Net developer
- New Relic
- Node.js
- NReco
- OAuth
- OAuth 2.0
- OAuth Demo Amazon
- OAuth Demo Google
- OAuth Demo Microsoft Azure
- Objective C
- Offshore Automation testing services
- Offshore custom software development services
- Offshore custom software development solutions
- offshore dot net services
- Offshore DotNet development company
- Offshore filemaker development company
- Offshore Filemaker Development Company In India
- Offshore FileMaker development services
- Offshore filemaker services
- Offshore Power BI development
- Offshore React development company
- Offshore React development services
- Offshore React Native development company
- Offshore React Native development services
- Offshore React services
- Offshore software testing
- Offshore web app services
- Offshore web developement services
- Offshore web developers
- Offshore web development
- offshore web development company
- Offshore web development services
- Outsorucing React services
- outsourcing app integration
- Outsourcing custom software development services
- outsourcing dot net services
- Outsourcing DotNet services
- outsourcing filemaker services
- Outsourcing Power BI company
- Outsourcing Power BI development
- Outsourcing React development
- Outsourcing React development company
- Outsourcing React services
- PDF writing tools
- Performance
- Performance Testing
- PHP
- PHP developer
- PHP MVC
- PHP My SQL development
- PHP MySQL tutorial
- php mysql web application development india
- PHP web development
- PHP webservice
- Power Apps
- Power BI
- Power BI development
- PowerBi developers
- Programming Languages
- Project Management software
- Project management system
- PYTHON
- Quickbase
- React
- React 18
- React app
- React app builder
- React bootstrap
- React customapp
- React developer
- react developer tools
- React developers
- React development company
- React development professionals
- React development services
- React experts
- react for front end development
- react front end development
- React Hooks
- React JS
- React JS app
- react js developer skill set
- React JS development company
- React JS example
- React JS web app
- React JS web development
- React JS web development company
- React mobile app development
- React mobile development company
- React Native
- React Native app developer
- React Native app development
- React Native app development company
- React native app development React developer
- React Native debugger
- React native developer
- React Native developers
- React Native development
- React Native development company
- React Native development services
- React Native mobile app
- React Native NPM package
- React programming
- React Redux
- react skills
- React technology
- React web app
- Reactjs
- reactjs developer skills
- Reactjs Development Service
- Reactnative
- RED HAT SERVER
- Remove term: cloud computing for SMEs cloud computing for SMEs
- Remove term: FileMaker consultants FileMaker consultants
- Remove term: Reactjs Development Service Reactjs Development Service
- Responsive Design
- Responsive UI
- Salesforce
- SAP
- Scrum Framework
- Security Testing
- Shift Left testing
- Shift Right Testing
- Shopify
- skills for reactjs developer
- skills required for react js developer
- Software Development
- Software development company
- software development company us
- software development in uk
- software development services in uk
- Software testing
- SQL
- SQL data consultant jobs
- SQL database
- SQL DATABASES
- SQL jobs
- SQL SERVER
- SQL SERVER 2017 RC1
- SQL Server Web Development developers
- SUSE LINUX
- tailored software
- TDD
- Twitter Bootstrap
- Typescript
- UBUNTU LINUX
- UK software development company
- Unit testing
- US software development company
- Visual Studio
- Visual studio express
- Visual Studio Mobile Center
- Visual Studio tutorial
- Web API
- web app development
- Web app development services
- web application development
- Web application development company
- Web Application Outsource Services
- Web applications
- Web Design
- Web designing and application development
- Web development
- web development experts
- web development services
- web publishing
- Web tokens
- Website Development
- wkhtml
- Wordpress
- WordPress Website Security
- Workflow Management software
- Xamarin
- XAMPP
- Zoho Creator